Transactions
Overview
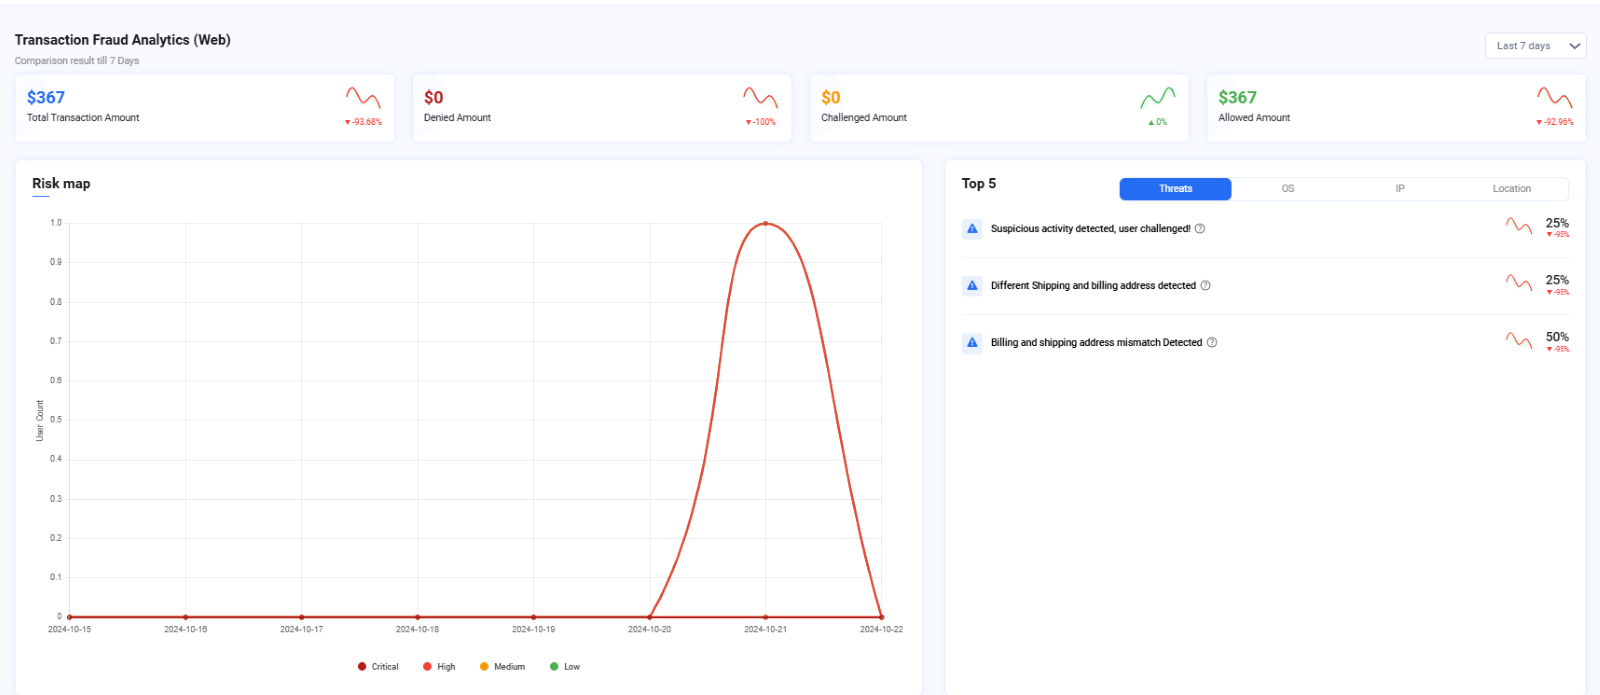
Transaction fraud analytics enables you to seamlessly track and manage all financial activities within your application. It provides insight into the total, denied, reviewed, and approved transaction amounts detected during the process.

Image depicting transaction fraud analytics logs
Total transaction amount: It gives the total transaction amount that was registered on the application.
Denied amount: Shows the total amount denied due to suspicious behavior.
Challenged amount: Indicates the amount flagged as moderately suspicious and required to be reviewed.
Allowed amount: Represents the transactions deemed non-suspicious and successfully allowed.
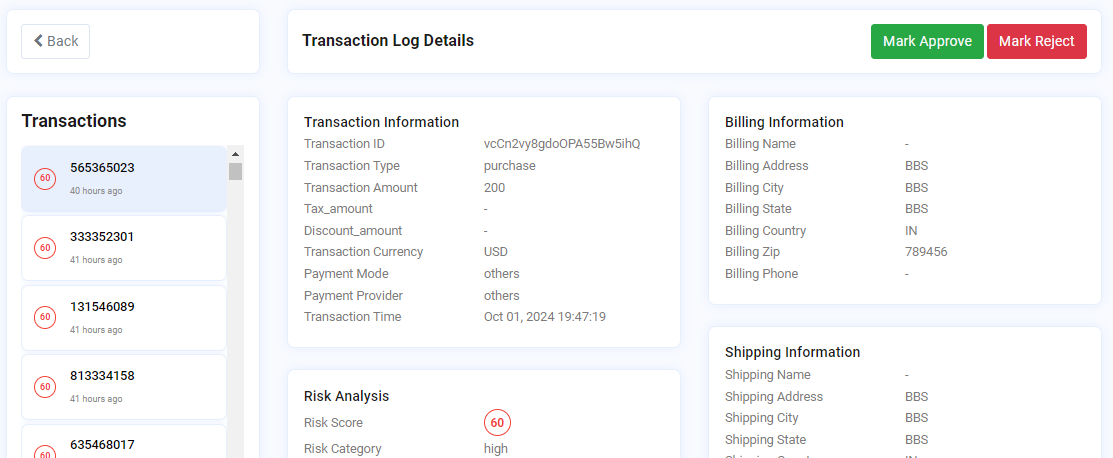
For transactions, if the risk score falls into the high category and suspicious behavior is detected, the transaction will undergo manual review. The user attempting the payment will see the transaction as pending but their order will be placed, while the Sensfrx user must manually approve or reject it, as demonstrated in the below picture.
If the transaction is approved, the order will proceed as usual. If rejected, the order will be canceled, and a refund will be issued.

Image depicting transaction log details of a selected transaction id
Note: There is no challenge option in case of transactions, rather there is a manual approval option.
The transaction fraud analytics dashboard consists of:
Risk Map
Top 5 suspicious activities
Transaction List
Risk Map
The Risk Map provides a visual summary of transaction-related risks detected in the application over time. The risk map shows the details in red (critical), orange (high), yellow (medium) and green (low) colors. The vertical axis represents the user count while the horizontal axis represents the date.

Image depicting Risk map for transactions
Top 5 suspicious activities
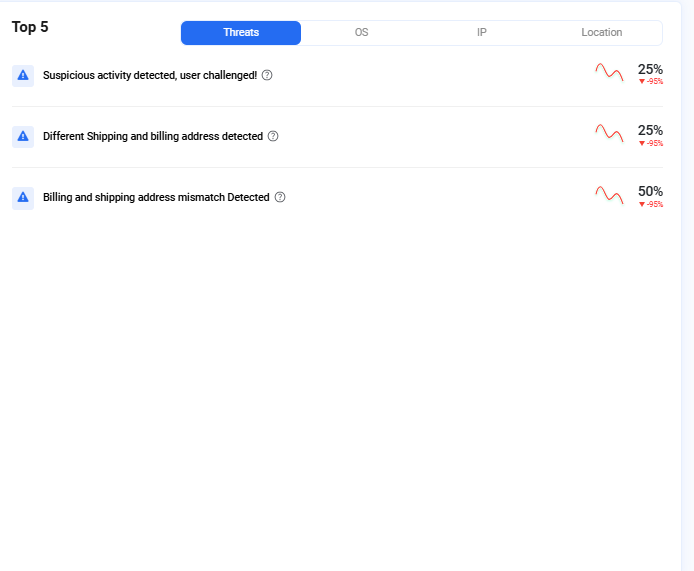
The top 5 suspicious activities are available in the right-hand side of the Dashboard along with their OS and IP details. There is also a trend graph depicting the trend of a specific threat over time, based on the selected date filter.
For instance, in the below image if the "Different Shipping and billing address detected" threat shows a downward trend, it indicates a decrease in this type of threat over the past week or month.

Image depicting top threats detected for transactions
Transactions List
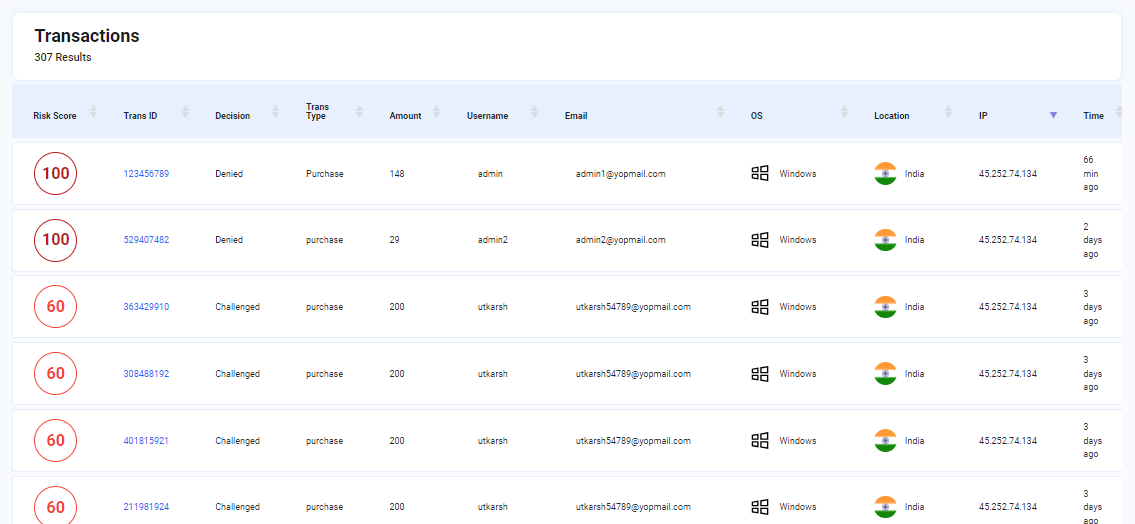
The transaction list provides the User with details about all the transactions that have been executed on the system with corresponding details that include Risk Score, Trans ID, Decision, Trans Type, Amount, Username, email, OS, Location, IP and time. The User can click on the respective Trans ID and view a detailed breakdown of it.
 Image depicting Transactions list