Account Security
The Account Security tab allows users to effortlessly monitor and oversee all login and registered user account activities within the application. User account fraud analytics is available on the top of the Dashboard which contains the total, denied, challenged and allowed login within the application.

Total logins: It gives the total number of logins that were registered on the application.
Denied logins: Shows the number of logins denied due to suspicious behavior.
Challenged logins: Indicates the number of logins flagged as moderately suspicious and required to complete a verification challenge.
Allowed logins: Represents the logins deemed non-suspicious and successfully allowed access.
You can use the "Filter Days" field to view logs for a specific time period, such as one week or 30 days.
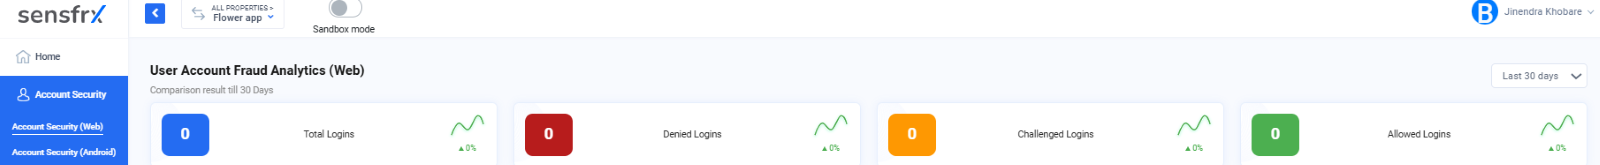
Image depicting User Account fraud analytics with filter field
Note: The user account fraud analytics is available for iOS, Android and Web platforms. Users can select the respective platform to see the analytics as seen in the below image.
The account security dashboard also consists of:
Risk Map
Top 5 suspicious activities
User List
Note: Risk Map, Top 5 suspicious activities and User List are common sections for all the sections.
Risk Map
The Risk Map gives a graphical overview of the account security risks detected in the application over a period of time. The risk map shows the details in red (critical), orange (high), yellow (medium) and green (low) colors. The vertical axis represents the user count while the horizontal axis represents the date.
The red graph depicts the critical logins detected with the respective date and total number of users. In the below picture one can see that on the date 2024-9-27 there were 5 users that showed suspicious behavior marked as critical (red).
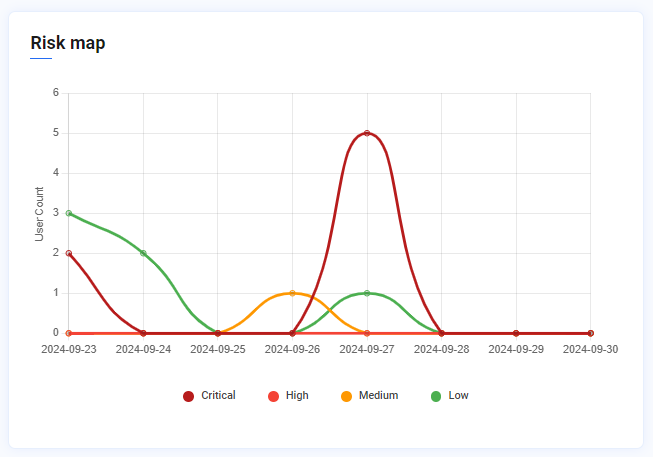
Image depicting risk map for account security
Top 5 suspicious activities
The top 5 suspicious activities are available in the right-hand side of the Dashboard along with tabs for OS and IP details. There is also a trend graph depicting the trend of a specific threat over time, based on the selected filter.
For example, if the "Device denied through API call" threat shows an upward trend, it indicates this is a new issue not detected in the past week or month.
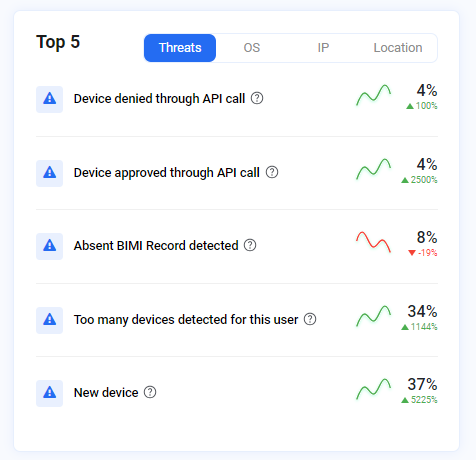
Image depicting top threats detected
User List
The list of all the Users that have logged in the system with their details that include risk score, User Name, Device/OS, Location, IP and Last Active/Created.
The User can select any user from the list and view a detailed breakdown of the risk associated with that respective user.
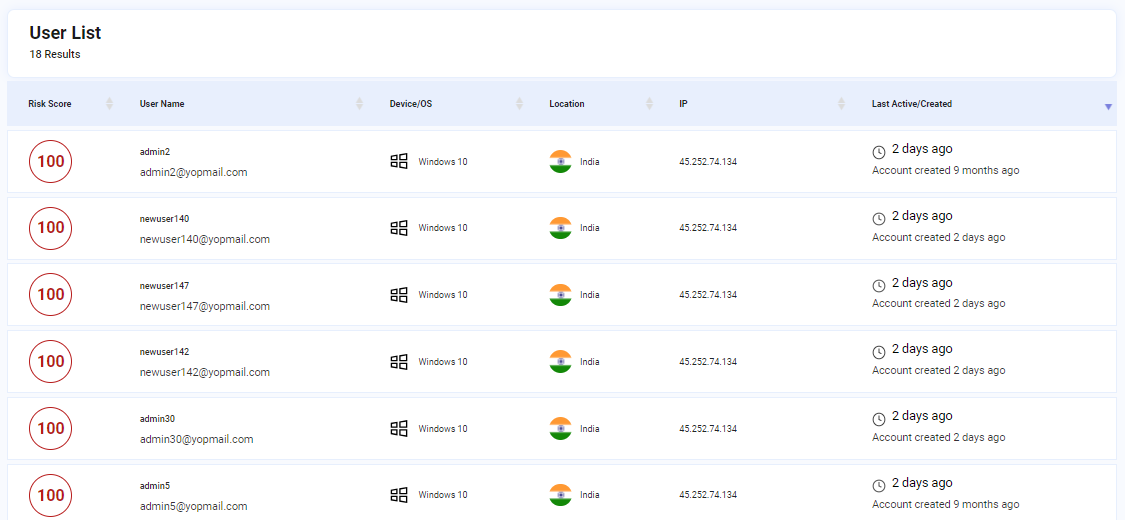
Image depicting user list
The below image appears when the user selects any id from the list.
It will show the recent activity list with an option as See observations.
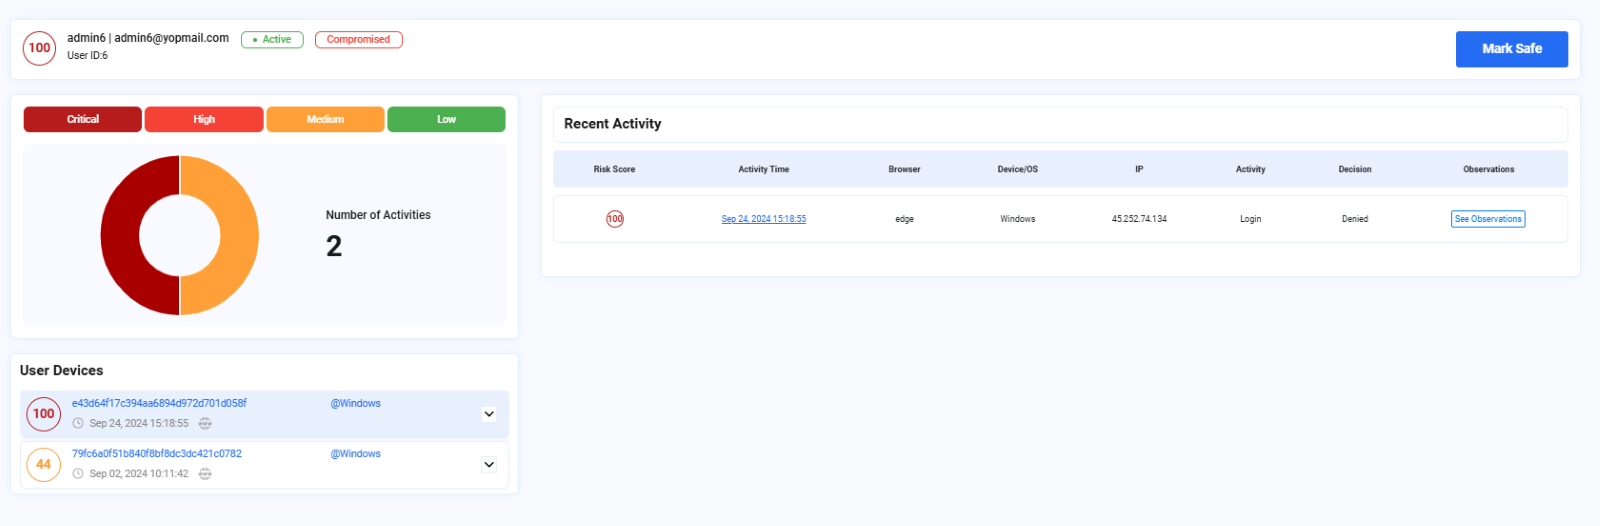
Image depicting a detailed overview of a user ID selected
When the user clicks on See Observations, they can view the details of the respective risk observations in a pop-up. It tells the user what were the parameters that were found suspicious.
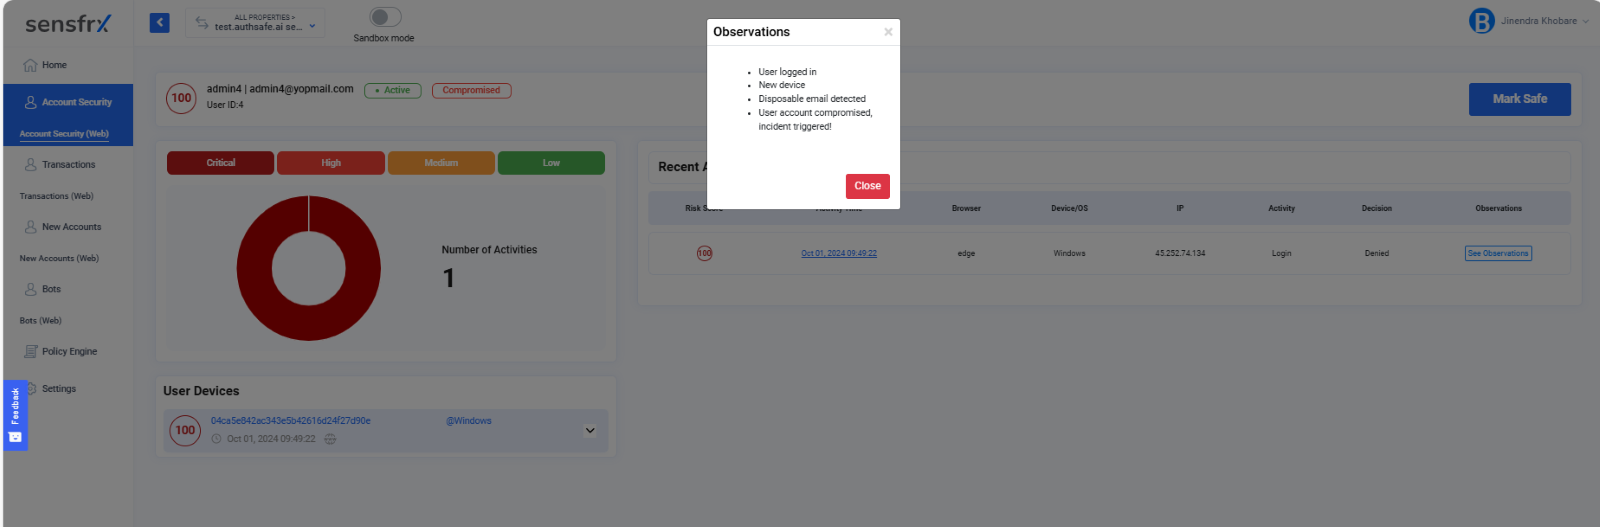
Image depicting pop-up listing the observations